Watching how criminal gangs shift their operations across the UK can help motorcyclists understand the importance of securing their bikes and stay ready when thefts spike in their area.
This map highlights the rises and drops in motorcycle and scooter thefts by comparing data from the most recent full month to the month before. Keep in mind – this is a monthly snapshot.

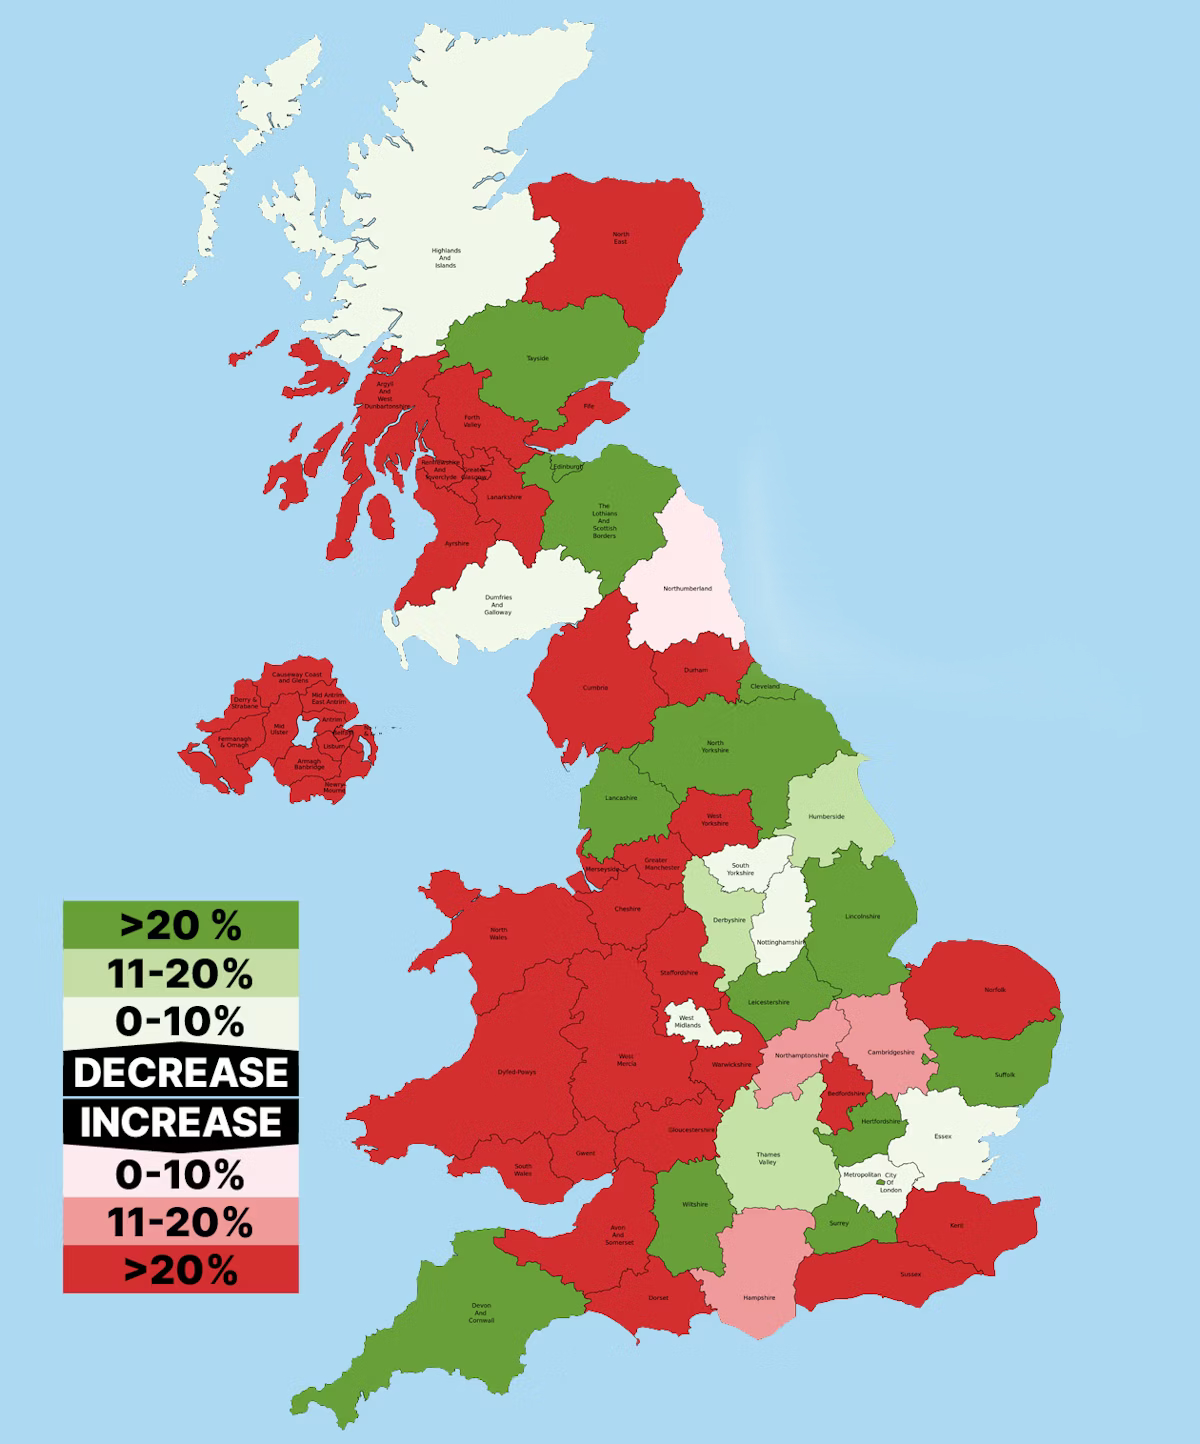
This month’s theft stats explained
After a map full of green last month, we’re seeing more red creeping back in this time, with Powered Two Wheeler (PTW) theft rates up by 261 compared to September. Still, many regions continue to show great reductions.
Fife and Dyfed & Powys have seen the biggest jumps, with crime up 300%, but it’s worth remembering this map highlights areas where crime is on the rise to alert you about possible criminal gangs moving into your area. While 300% sounds huge, in Fife that’s just an increase from zero to three thefts, and in Dyfed & Powys it’s from one in September to four in October.
South Wales Police reported a sharp increase of 212.5%, with thefts rising from eight to 25. Sussex also saw a jump from 25 to 55, marking a 164% rise. Avon and Somerset’s figures are troubling as well, climbing 61.33% from 75 to 121.
The Metropolitan Police area still has the highest PTW theft rate, with 479 scooters and motorcycles stolen, but that’s a 2.44% decrease and part of a steady downward trend after last month’s impressive 20.54% drop in this densely populated region with a large number of scooters. It’s also great to see the West Midlands Police continuing to drive theft numbers down.
The City of London saw thefts drop from one to zero this month, taking the top spot, but North Yorkshire really shines with a 72.22% decrease, going from 18 thefts to just five. Lincolnshire isn’t far behind, cutting its PTW thefts in half from 16 to eight.
Total PTW thefts October 2025: 1857 (Up 261 from September)
Leave a Reply